Basics, Thinking in Tables
Review
If your Stats 425 is still kicking around in your head, you might remember Bayes’ Theorem. Which generalizes a nice, symmetric property of Conditional Probability
$P(A|B)P(B) = P(B|A) P(A)$
Into the following
$p(H|D) = \frac{p(H)~p(D|H)}{p(D)}$
Where H is your Hypothesis and D is your Data.
Bowls
In a trivial example, we’ve got two identical bags with colored stones inside.
Bag 1 has 10 white stones and 20 black stones.
Bag 2 has 15 white stones and 15 black stones.

If we picked a bag at random and pulled out a white stone, what's the probability that we selected from Bag 1?
The trick to these problems is to swap the values from the story problem into the Bayes’ equation:
- Our Hypothesis is “Selected from Bag 1”
- Our Data is “Drew a white stone”
$p(B1|W) = \frac{p(B1)~p(W|B1)}{p(W)}$
We’ll assume either bag is as likely and use the proportion of Bag 1’s contents
$p(B1|W) = \frac{(1⁄2)~(1⁄3)}{p(W)}$
The only trick is figuring out the value of P(W), which can be expressed by blowing out the exhaustive conditional probabilities in the denominator
$p(B1|W) = \frac{(1⁄2)~(1⁄3)}{P(W|B1)P(B1) + P(W|B2)P(B2)}$
$p(B1|W) = \frac{(1⁄2)~(1⁄3)}{(1⁄3)(1⁄2) + (1⁄2)(1⁄2)}$
Solving, we get
$p(B1|W) = 0.4$
Tables
As your hypothesis gets more complicated, however, Allen Downey’s book Think Bayes introduces structuring the problem via a helpful table to assist with the bookkeeping.
M&M
The problem that introduces these tables looks like the following:
We’ve got two bags of M&Ms from two different years, where the color distribution found in each bag was
| Bag | 1994 | 1996 |
|---|---|---|
| Blue | .24 | |
| Brown | .3 | .13 |
| Green | .1 | .2 |
| Orange | .1 | .16 |
| Tan | .1 | |
| Red | .2 | .13 |
| Yellow | .2 | .14 |
Then, you take an M&M from each bag, and first one is yellow, the second is green.
What is the probability that the yellow M&M came from the 1994 bag?
Equivalently, this also means that the green M&M also came from the 1996 bag. In lieu of writing out the fraction as above, then deconstructing the denominator into all exhaustive probabilities for selecting yellow from either bag and green from either bag, we’ll use the “Table Method.”
But first, we’ll restate the problem in terms of hypotheses.
- A: Bag 1 is from 1994, Bag 2 is from 1996
- B: Bag 1 is from 1996, Bag 2 is from 1994
We take the yellow, green pick as given and construct our table.
from IPython.display import Image

Image('images/mnm.PNG')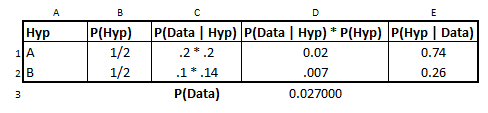
- Each bag is equally likely, which explains column
B - The values in each cell for column
Care the probability of each draw, given that hypothesis. e.g. Assuming Bag 1 is 1994, we had a.2chance to draw yellow and a.2chance to draw green from Bag 2, assumed to be from 1996. - Column
Dis just plug and chug - The value of
D3is the column sum, or that exhaustive probability we didn’t want to do by hand above - Finally, column
Eis just dividingDthrough by the column total, which completes the form of the Bayesian Equation and normalizes the data.