Best Picture Consolation Prizes
Last Time on Dragon Ball Z
I sat down to figure out when the announcements for this year's Academy Awards nominees were coming around. Some "basically-napkin-math" later, I'd narrowed it down to three dates:
- Tues, Jan 23rd
- Thurs, Jan 25th
- Tues, Jan 30th
Poking around a bit further, I found some really weird year-over-year shifts in the dates that they'd announced in the past, as well as some uninspiring numbers regarding viewership in recent years. If the Academy's job was to get people interested in watching their show-- movie enthusiasts and casual viewers alike-- they weren't doing a great job.

... that was until I learned that my slick prediction could have been done away with after like 30 seconds of Googling.
Bummer. But hardly something I can chalk up as a loss. I barreled through so many of my "I'll learn that later"s while figuring out how to wrangle and distill a mountain of messy data. I got to put a narrative to all of the errant trivia factoids I'd memorized about movies I'd never seen and awards I didn't really care they won. And damn it, I was bang-on with the conclusion I came up with, even if my plausible deniability isn't doing so hot.
January 23rd, for anyone keeping score at home.
More than anything, I feel like I understand the industry better-- the trends, the outliers, the anecdotes. I started in on the back half of this piece with a few hypotheses, a ton of data, and an overwhelming desire to figure out what it all meant.

It may have always been the case, but particularly in the last five or so years, there's been a mutual handcuffing between the Academy Awards to the movies that aspire to win them. Oscar Bait is a strategy that's been learned over the years. And as far as I can tell, they've thrown away the key.
The Data
Remembering the Alamo
Earlier that week I'd read a really cool piece by Alamo Drafthouse where they were looking at best-performing box office movies at their chain vs the rest of the industry. They cited using Box Office Mojo as their data source for industry gross, and then threw their in-house numbers up against it for color. They were really cool when I started nerding out with follow-up questions.
And so when I found myself curious about the per-week performance of movies, their article and the website that they'd used was already on the mind. At this point, it was a matter of figuring out how to get the data from all of these separate per-movie pages and into one unified set so I could compare and contrast at scale.
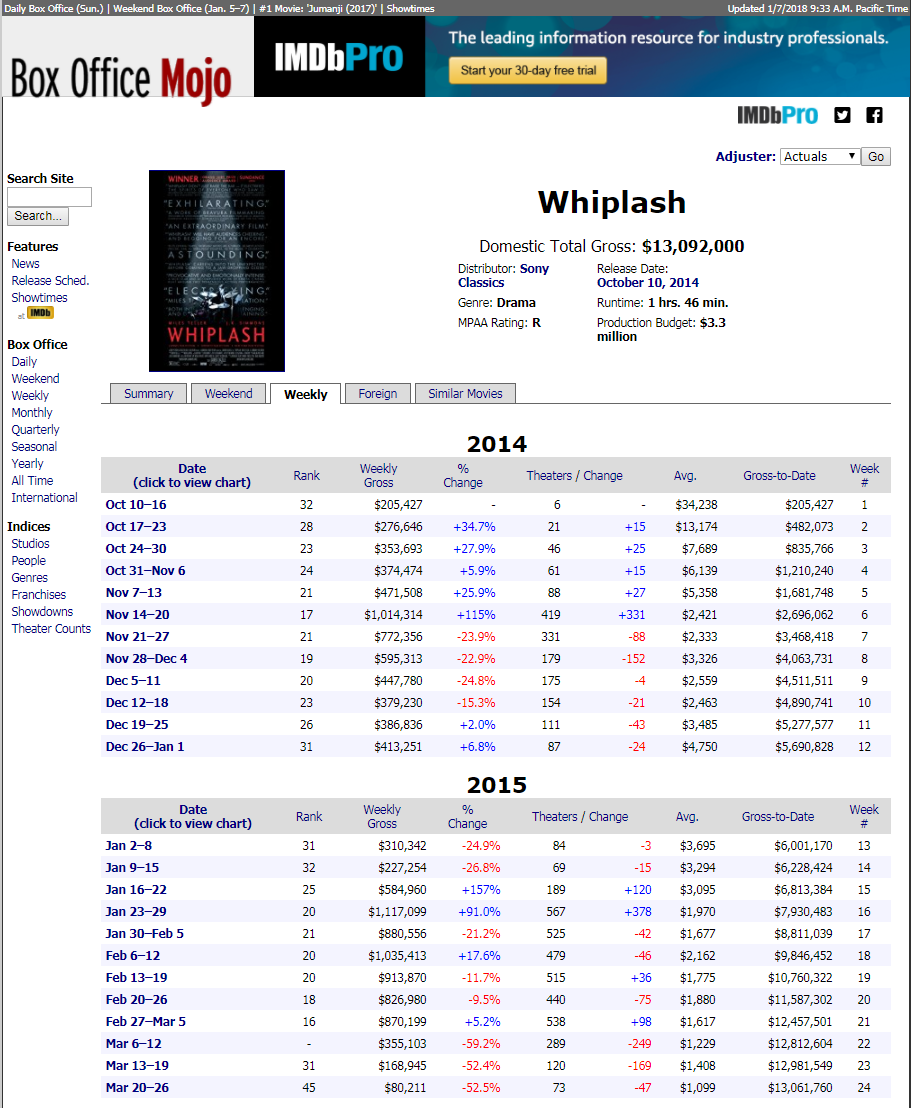
Box Office Mojo
Give this site your traffic-- they've got some of the coolest, publicly-available data on the whole Internet, IMO.
I relied heavily on the "Weekly" tab for each of the movies I gathered data for. In addition to useful overall metadata such as Runtime, Total Gross, and Production Budget (upper-right), this site has week-level Box Office information, including:
- The Friday to Thursday Date Range of the Data
- The popularity Rank of that movie during the week
- The Weekly Gross as well Gross to Date
- How many Theaters were showing the movie that week
- The number of weeks (Week #) the movie had been released for
Getting at the information I'd need meant compiling a list of all Best Picture nominees, searching the site for a particular movie, selecting the correct result (looking up "Her" was comically tedious), navigating to the Weekly tab, and copying the relevant elements from the tables into a unified data set. Rinse, repeat for the 166 movies that have been up for Best Picture since 1990. By the end of the day, I was sitting on 3,845 records-- a healthy amount of data.
Obviously, there was a lot of data cleaning involved, but I want to highlight two fields right out of the gate:
-
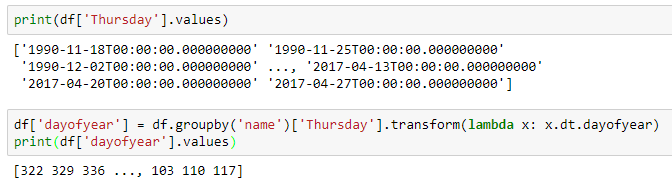
Thursday: The data was at a weekly clip from Friday to the following Thursday, so I parsed out the string in the "Date" field and figured out what single date to use when trying to plot the row.
- e.g. "Nov 28-Dec 4" for a movie in 2014 would resolve as "2014-12-04" Typically when looking at Box Office data, Friday, Saturday, and Sunday account for more revenue than the other four days combined. But by splitting each observation in the data at week-level and anchoring on Thursdays, I'm getting an apples-to-apples comparison of how movies perform at a fairly fine grain.
-
Day of Year: When trying to compare date-related information of two movies from separate years, I needed a common metric to join them over. I accomplished that by getting the day number for the year.
- Jan 1st → 1st
- July 8th → 189th
- New Year's Eve (on a Leap Year) → 366th
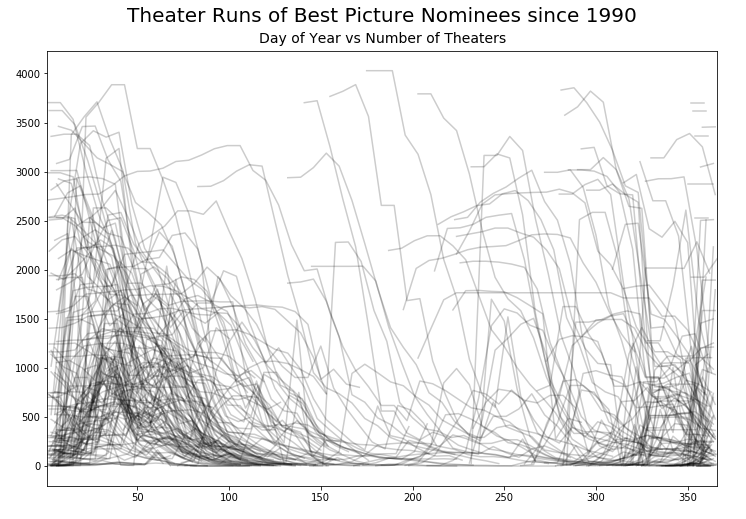
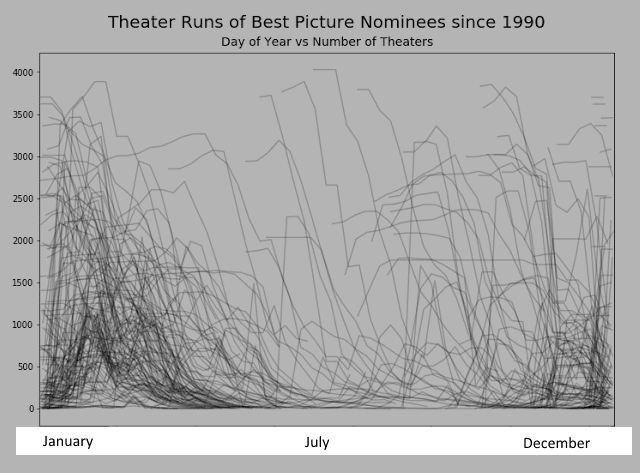
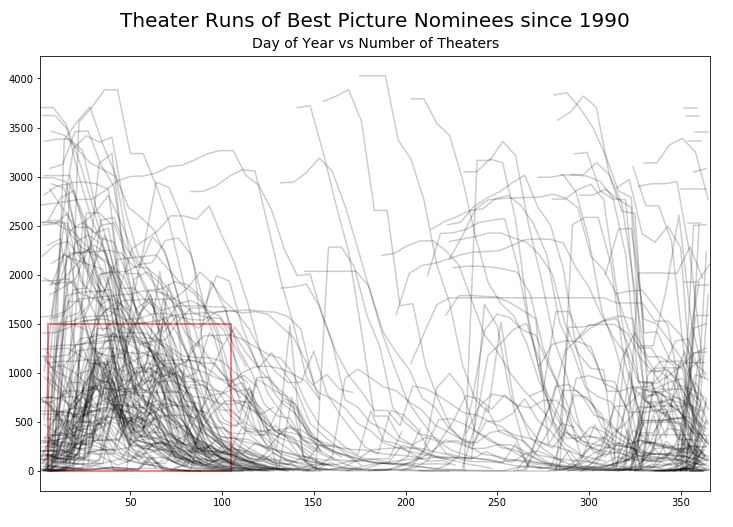
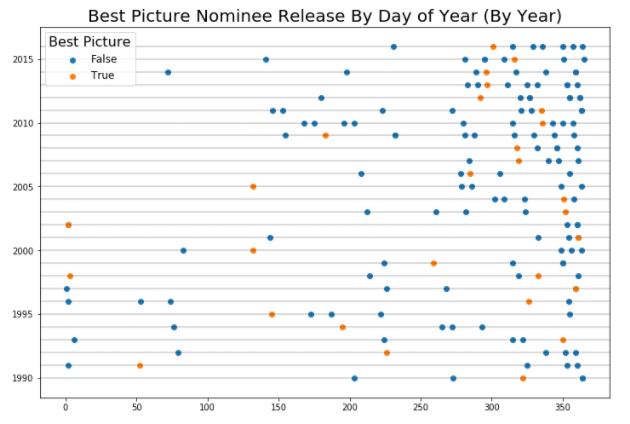
Plotting out the number of theaters showing a movie by day of year revealed some interesting bunching near the beginning and end of each year.
Premieres
Patterns in Releases...
If we wanted to get a more distilled look at the picture above, it'd be helpful to get at the premiere information per movie. This simply meant sorting all of the data by the Thursday date and grabbing the first row for each distinct movie name. Binning by day, this looks like you'd probably expect:
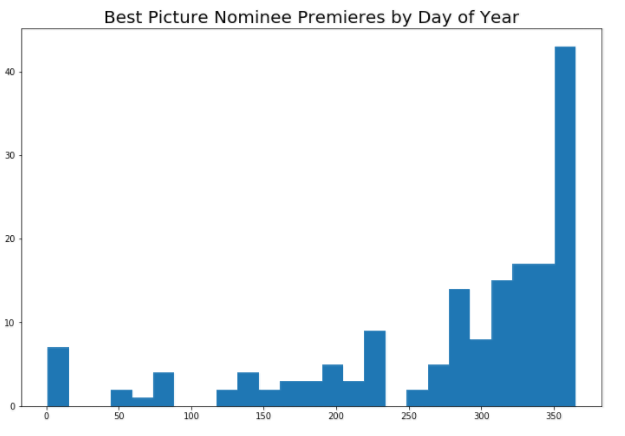
Curiously, the "cluster near the end of the calendar year" phenomenon has become more pronounced over time.
... Meet Patterns in Announcements
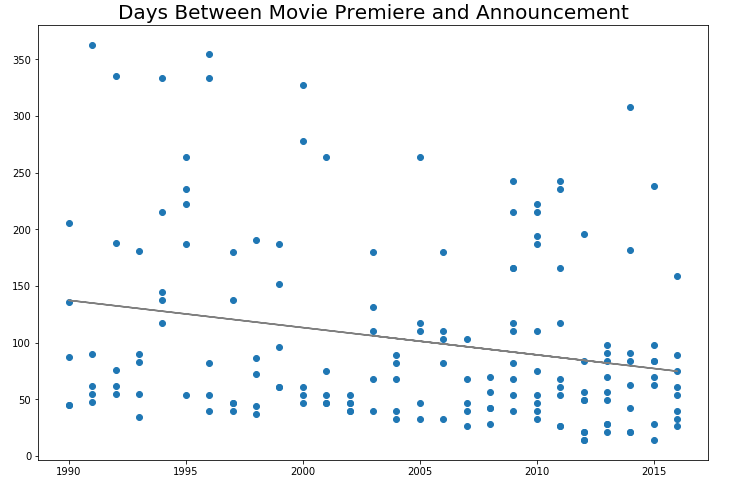
As you might recall from my last post, while the release dates are becoming increasingly end-of-year-centric, the announcement dates are, in turn, creeping up.
For each movie, I calculated the difference between its release date and the date that it was nominated for best picture, then plotted that pattern over time.
That effect becomes even more pronounced when I average these values at the year level.
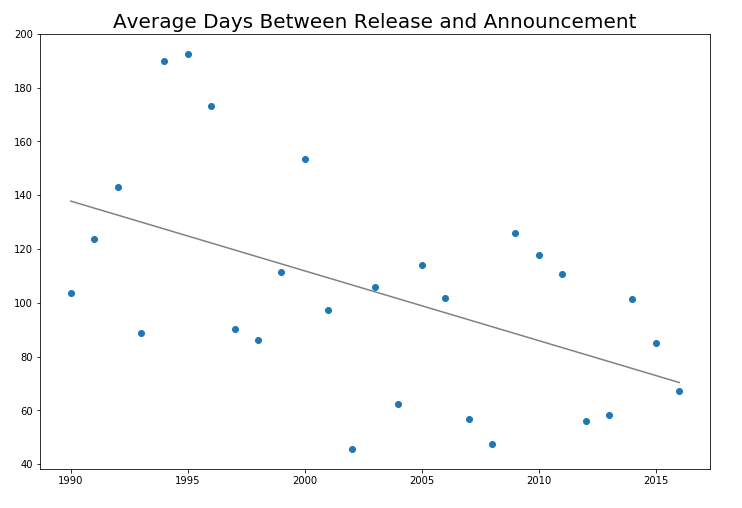
Premiere dates and announcement dates are slowly inching together like a timelapse of a petri dish. There's gotta be something here. To explore that thought, let's see if we can glean anything by drilling in by year.
Through the Years
I whipped together a function that takes a year, aims at my master data set, filters down to the relevant information, and compiles the results to a format we can use to plot everything out. This is what we'll use to examine the relationship between a year's Best Picture class and its Academy Award activity.
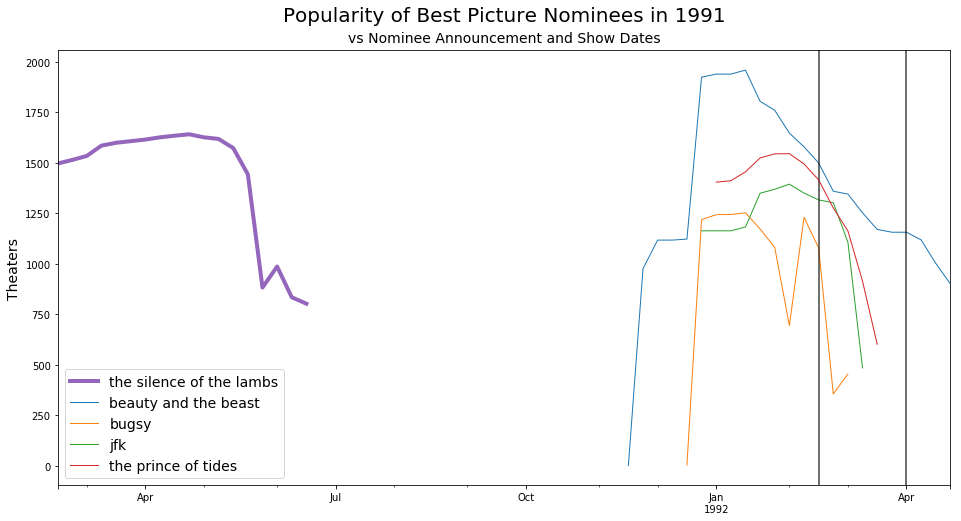
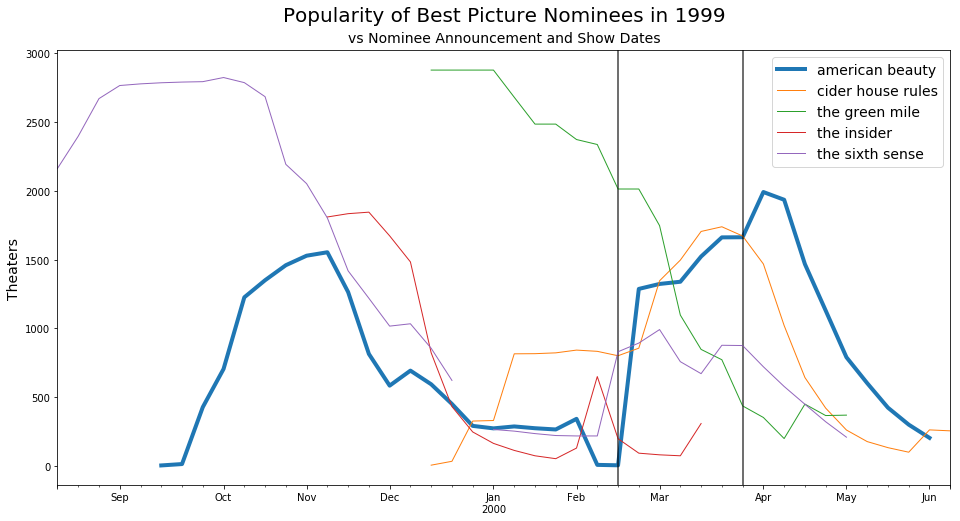
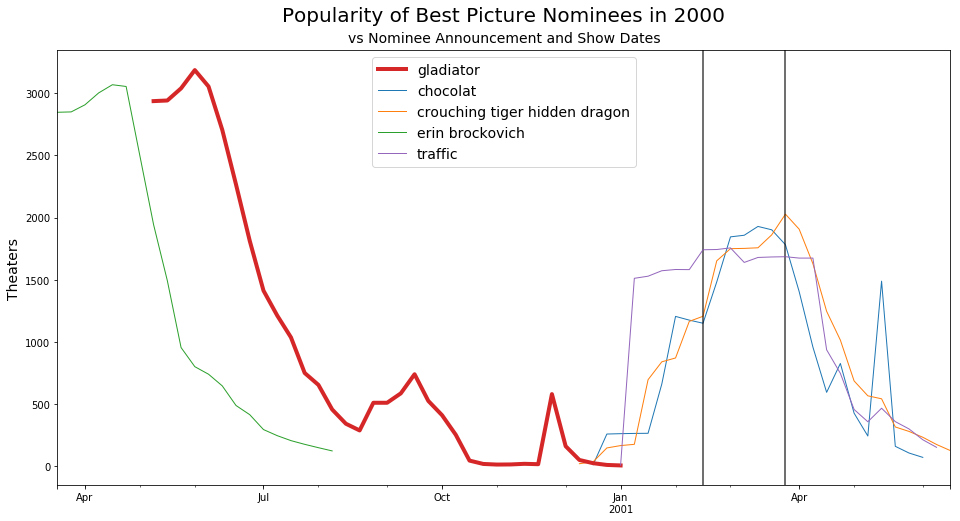
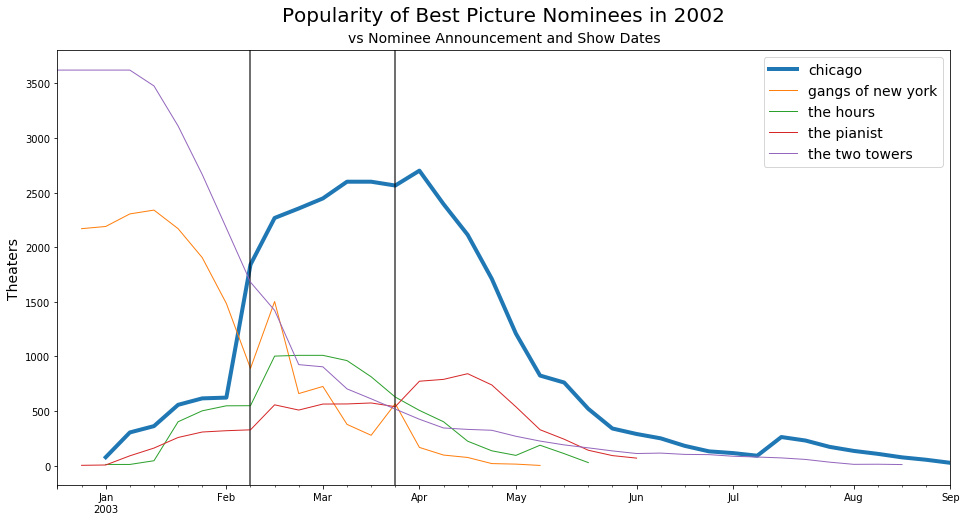
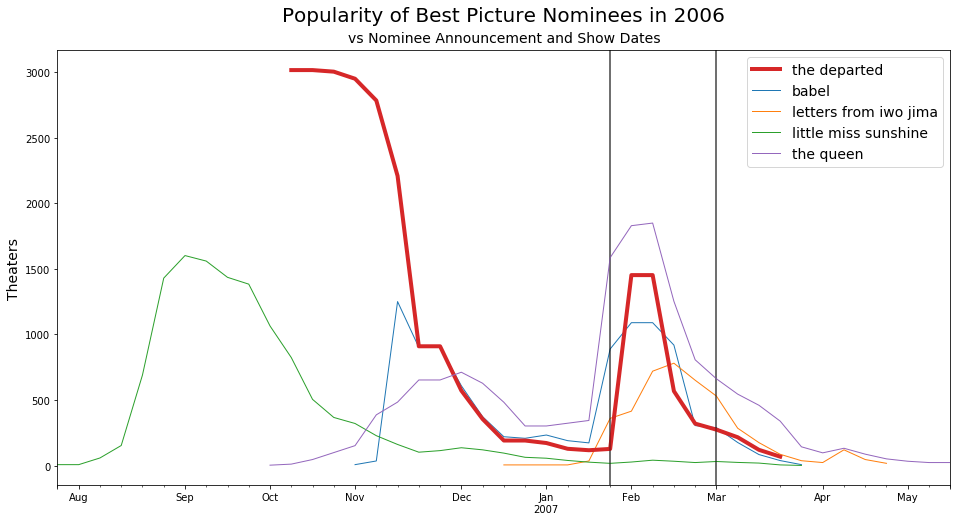
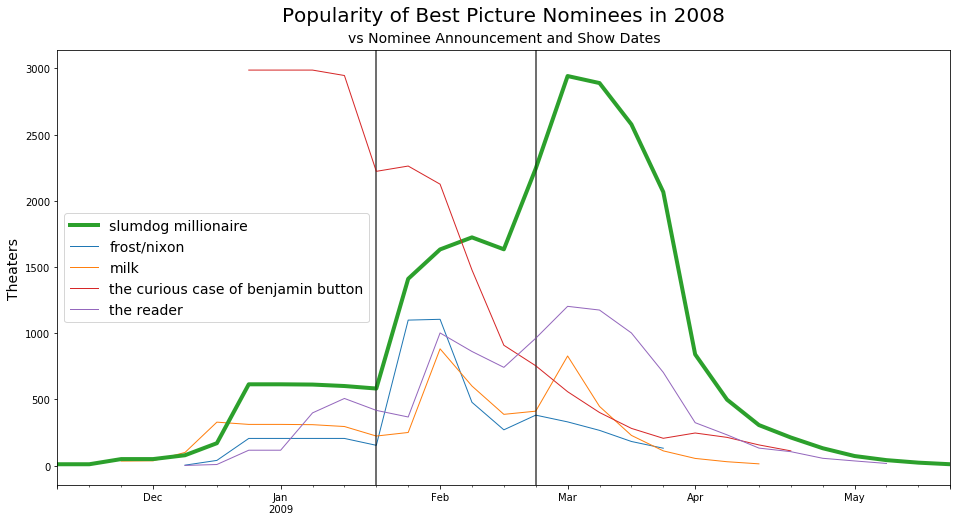
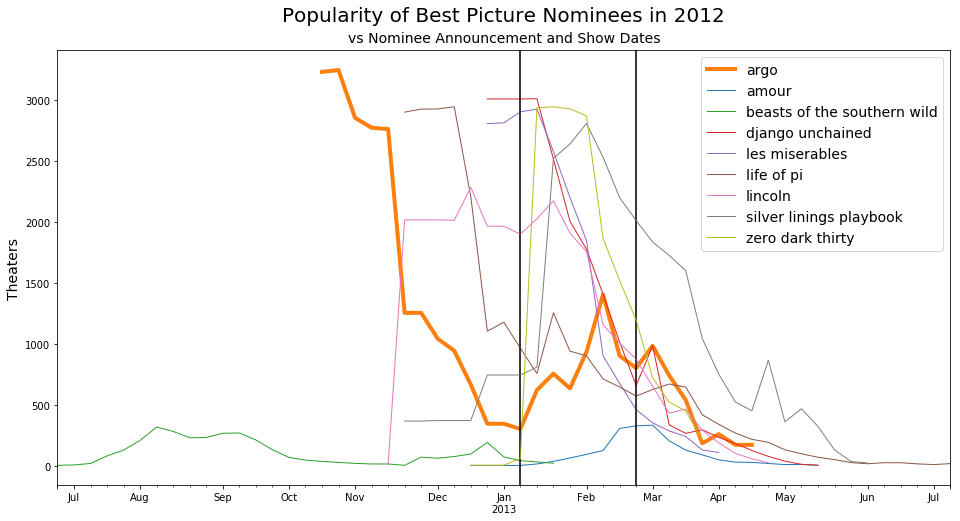
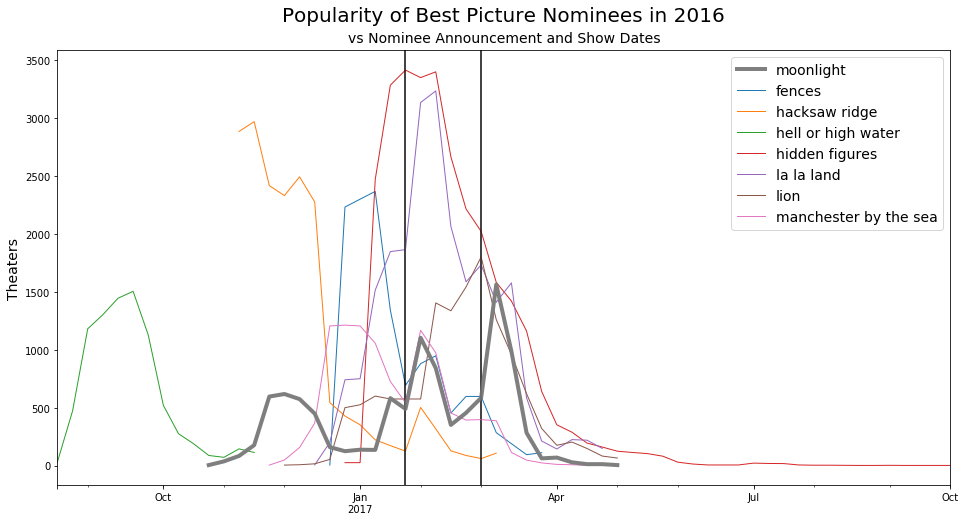
Reading the Visualizations
Each viz has:
- All of the movies nominated, with that year's winner in bold
- An x-axis of the Thursday dates for each movie.
- A y-axis noting the number of theaters a movie was shown in on a given week.
- Two vertical bars, representing the date of that year's announcement and award show, respectively.
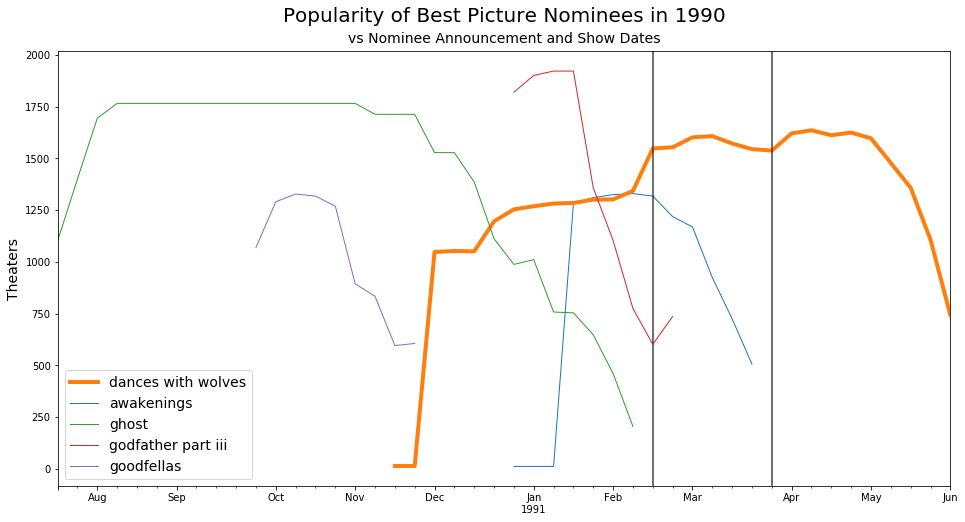
If you found yourself surprised by how popular the movie Ghost was, or thought it was funny (funny-peculiar) that Goodfellas only ran for 8 weeks, or remarked at how Dances with Wolves got more popular as time went on, then you're probably reading this correctly.
I'm going to go through a ton of these, skipping around some of the less-interesting years, but three things I want you to keep mind are:
- When are these movies releasing?
- What's the relationship between announcements/winning and popularity?
- What patterns do you notice in the number of overlapping theater runs?
1991-2008
Silence of the Lambs released on Feb 14, 1991-- one day after the announcement of the Best Picture nominees for the Oscars that aired that year, and was thus lumped into the next calendar year's releases. Fittingly, the movie waited patiently until the time was right, then it sprung from its year-long rest and won: Best Picture, Best Director, Best Actor, Best Actress, and Best Adapted Screenplay.
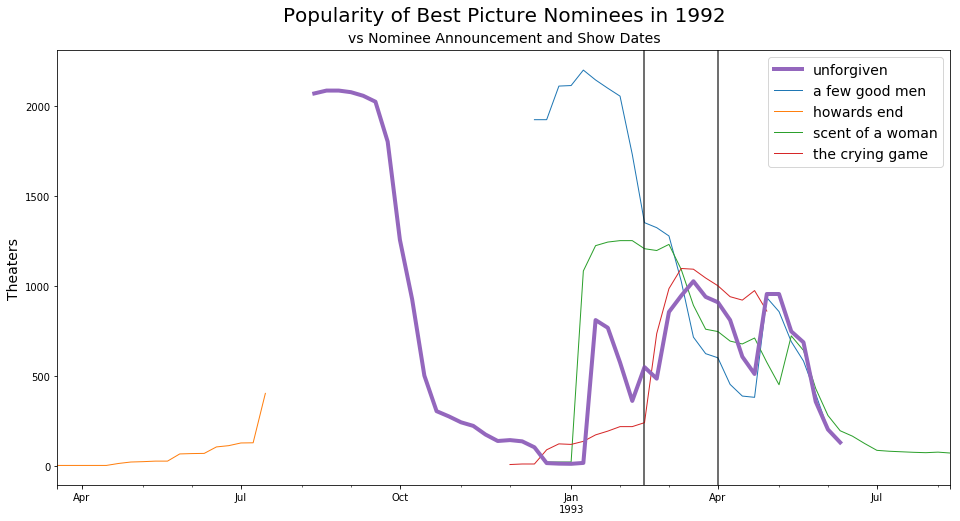
'94-'96 were boring.
Or how about that time the Academy straight-up picked American Beauty out of the trash, brushed the dust off, invoked the Five-Second Rule and re-released it to more fame that it had originally gotten?
2009 and Beyond
In 2009, the Academy decides to open up the candidate pool for Best Picture from 5 to 10 (the first deviation in nominee count since the 40s).
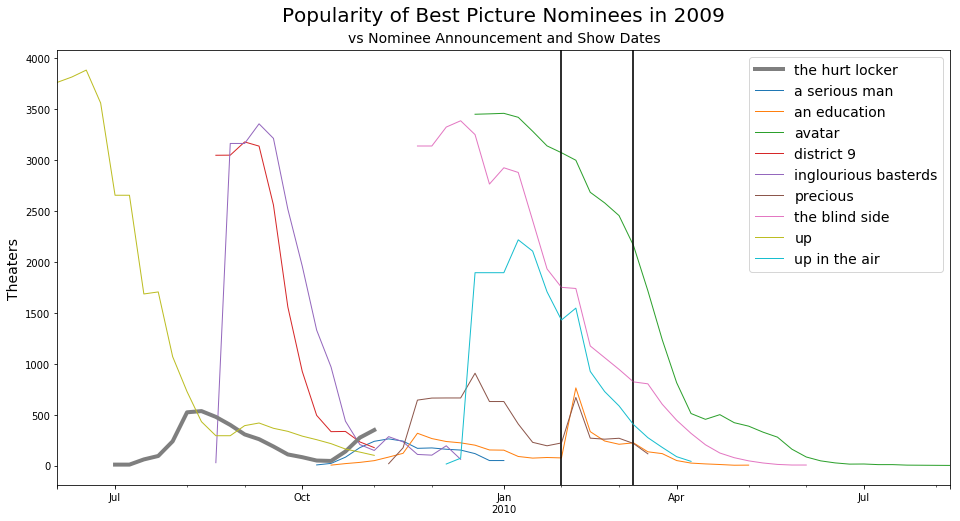
And every year after, this confusion continues in a stretch that I like to call the "Wait, What the Hell Just Won?" Era. Characterized by:
- A saturation of good movies and blockbusters at the tail end of the year. This means that people have to more-heavily weigh their options when deciding what to see.
- If they're currently in theaters, the movies that get nominated enjoy a nice bump in popularity.
- And if they win, they get another hike as people play catch-up with the cultural zeitgeist.
Finally, we arrive at last year's show.
- Hacksaw Ridge's premise was prophetic of its popularity.
- There may have been a mix-up in the announcement of the winner, but the theater count didn't - seem to notice.
- After dethroning an incumbent Rogue One as most popular movie, Hidden Figures went on to have a damn-impressive return ($25M budget vs $170M gross).
Recap
Well that was fun, but what did we learn?
Hopefully it helped reinforce the notion of 'Oscar-bait' movies releasing at the end of the year. I think that this was something that I had always assumed in passing, but if you scroll back through the visuals, you'll notice that the X-axis auto-fits to later and later months.
This, of course, leads to many overlapping releases and movies sort of stepping on each other's toes, so to speak. However, this over-crowding effect is partially mitigated by popularity boosts brought on announcements, almost across the board, and then again for the movies fortunate enough to win.
But is that benefit strong enough to outweigh the crowding?
How Important is the Announcement?
Before I could answer that, I needed to get a quick pulse on how the industry was looking.
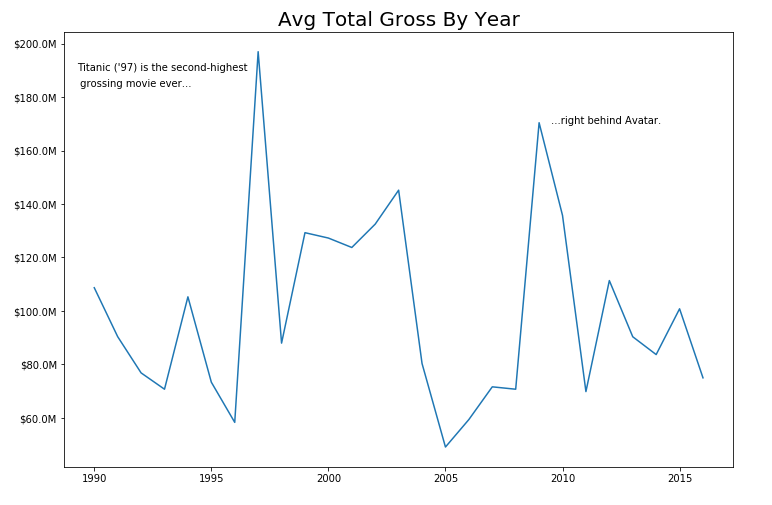
Total Gross
Looking at the average Total Gross that the nominees pull in by year, you can see that apart from some outlier data, recent performance looks as-good-or-worse than historical values.
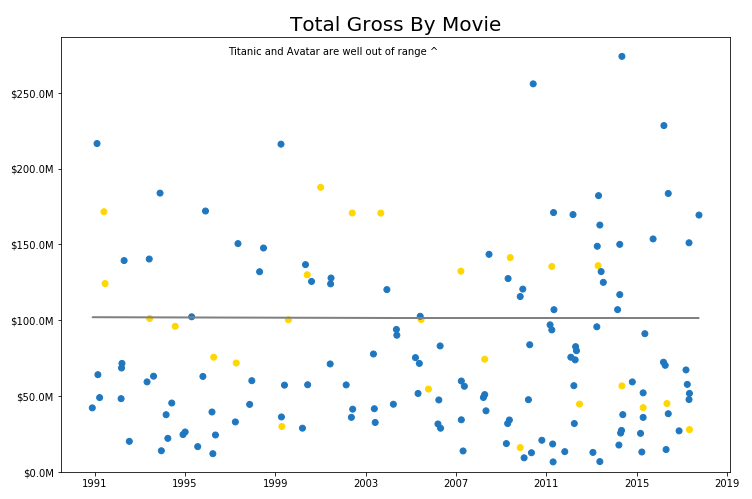
Breaking this same data out at the movie level, the Total Gross seems to be holding steady-- a hair down, even-- over time. Which looks benign, until you consider the fact that $100 in 1990 is the same as $187 today.
Before and After
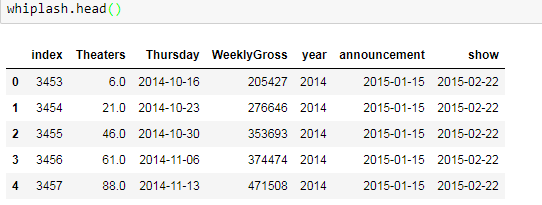
I had one final angle that I wanted to come at this with, but before I could do that, I had to make one more transformation in my data. Below, I filtered my data down to just Whiplash as an example.
- Recall that our data is captured at a weekly grain for the duration of a movie's run.
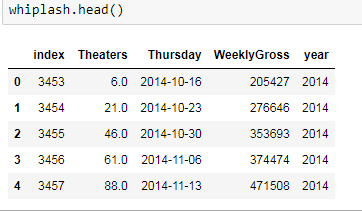
- Marrying in the Academy Show/Announcement data from the last post, we get:
- Which lets us code each week's revenue line as either Before or After the announcement date.

- And determine how much money was made on either side of the announcement
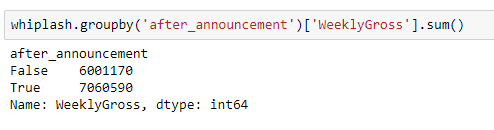
- Or more interestingly, what percentage of a movie's total take happened after the Best Picture nod?
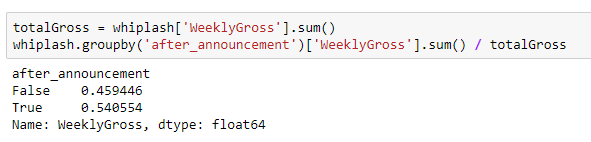
Because if you can get at that information-- after the slog of scraping, of data entry, of cleaning, of manipulating-- you can apply the same method, not at the movie-level, but at the year-level. All of that distilling and you arrive at a simple scatter plot:
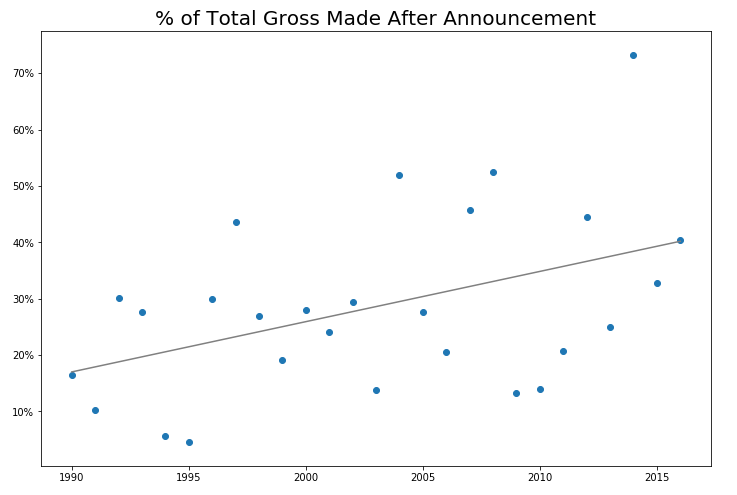
Which shines a light on how much the Academy has come to drive this particular corner of the movie industry in recent years.
Conclusion
Going all the way back to the premise of my original post: given that this year's award show is going to air on March 3rd, I had backed into three candidate dates that the announcement was likely to fall on: Jan 23rd, 25th, or 30th.
Taking the train of thought of this post to its logical station, we've got enough information at this point to make an educated guess. The Academy has played an increasingly active role in bolstering their nominees at the box office in recent history. Thus, they're likely going to pick a date that best helps this year's Best Picture class. Therefore, my guess relies on which movies are most likely to get a nod this year.
Assuming the Golden Globes are a close enough proxy (which is probably a whole different analysis in its own right...), the 10 candidates that they narrowed down to this year are:
Call Me By Your Name
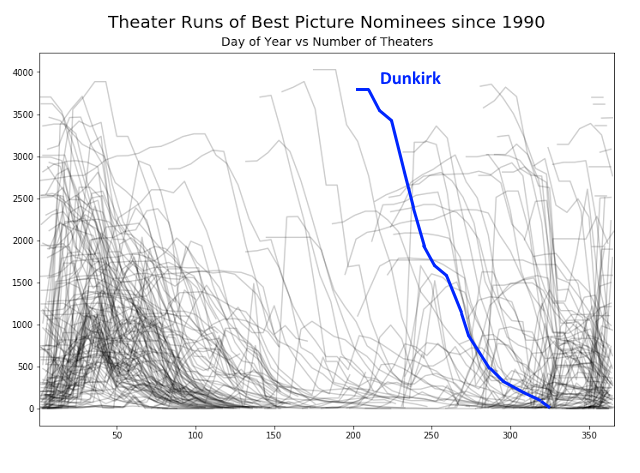
Dunkirk
The Post
The Shape of Water
Three Billboards Outside Ebbing, Missouri
The Disaster Artist
Get Out
The Greatest Showman
I, Tonya
Lady Bird
Lo and behold, 8 of the 10 of these have showtimes near me in the next week.
As I mentioned up top, the scheduled announcement date was public knowledge that I'd flat-out overlooked. However, knowing what I now know about the role that the Academy plays in the performance of its Best Picture nominees, and after realizing that this year's frontrunners are all currently showing, it feels like a no-brainer that they'll be announcing on the soonest date I'd picked out. Strike while the iron's hot, yeah?
All blundering aside, I hope that if you made it this far down you enjoyed reading. Here's a link to the repository that I used to put everything together, including the raw box office data that I spent a day getting at-- hit me up on Twitter if you wind up doing anything cool with it!
Cheers,
-Nick