Hey, How's it Going? (Empirically)
Fair warning: Some less-than-wholesome language below.
Background
Generally speaking, I've always struggled with mental health stuff and in turn, go through varying levels of "do something about it." Feels like I spend a good chunk of time vacillating wildly between "too anxious to keep anything straight" and "too depressed to want to keep anything straight." Of course, there are long tears where this is less the case, but it always felt borderline-arbitrary how things would just come and go.
So as I've mentioned in previous posts, I've been using a mobile app called Daylio for the better part of a year. It was recommended to me by my good friend Will when I was going through something of a slump as a way to try and sort things out. Figured it was probably a better better approach to do something instead of literally nothing from a monitoring/reflection standpoint. Naturally, I gravitated to something that would metricize what I couldn't get a good handle on, because:
Daylio Crash-Course
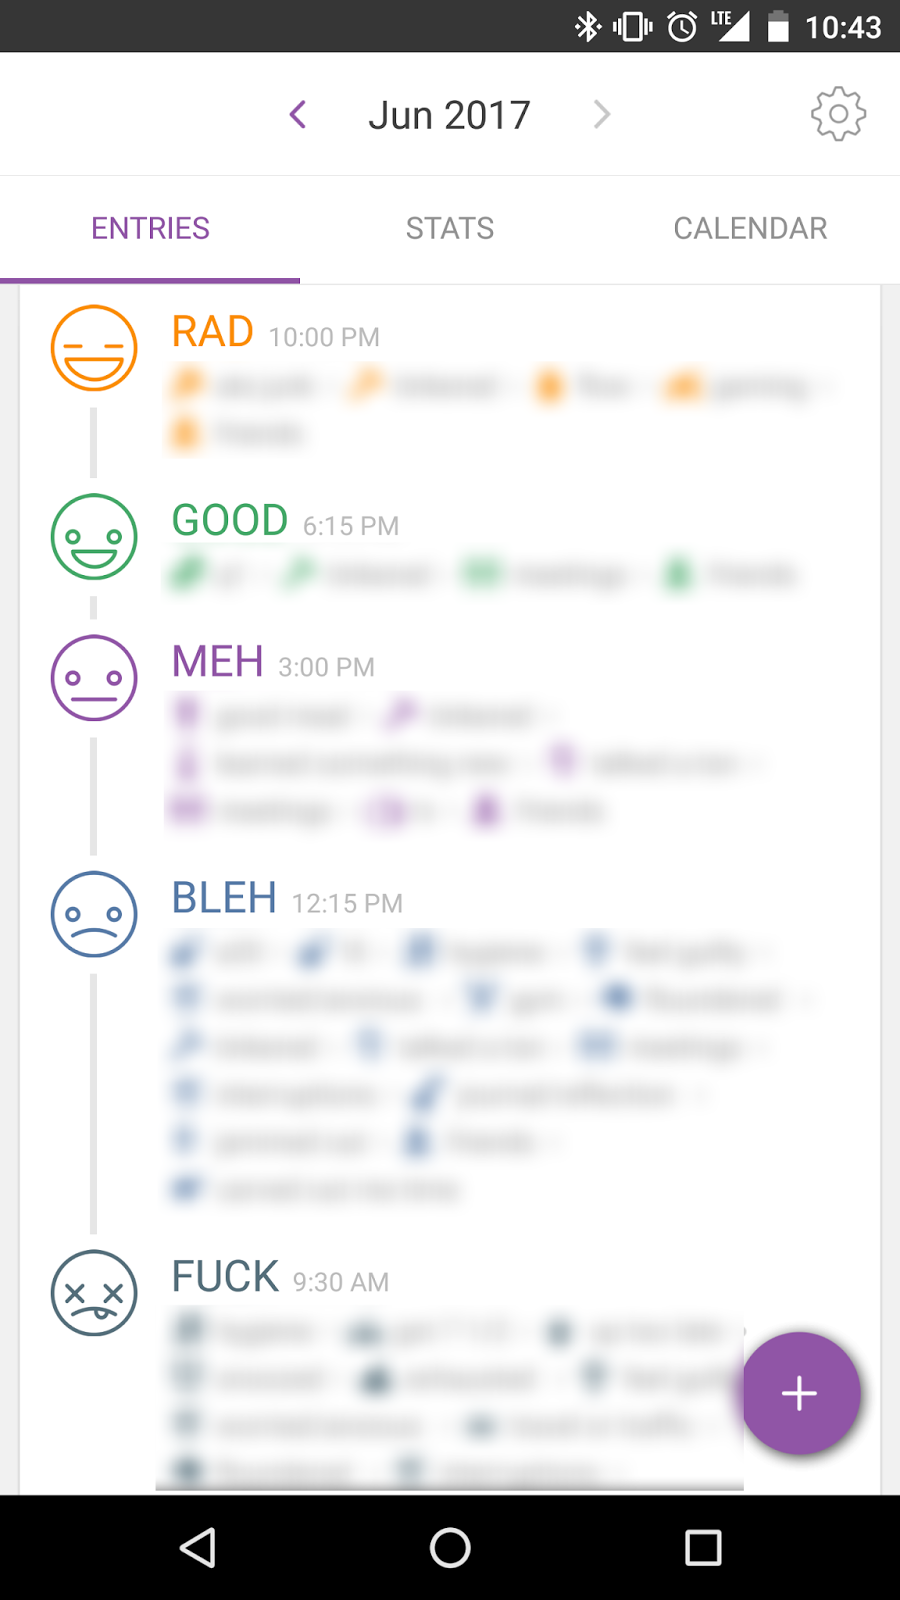
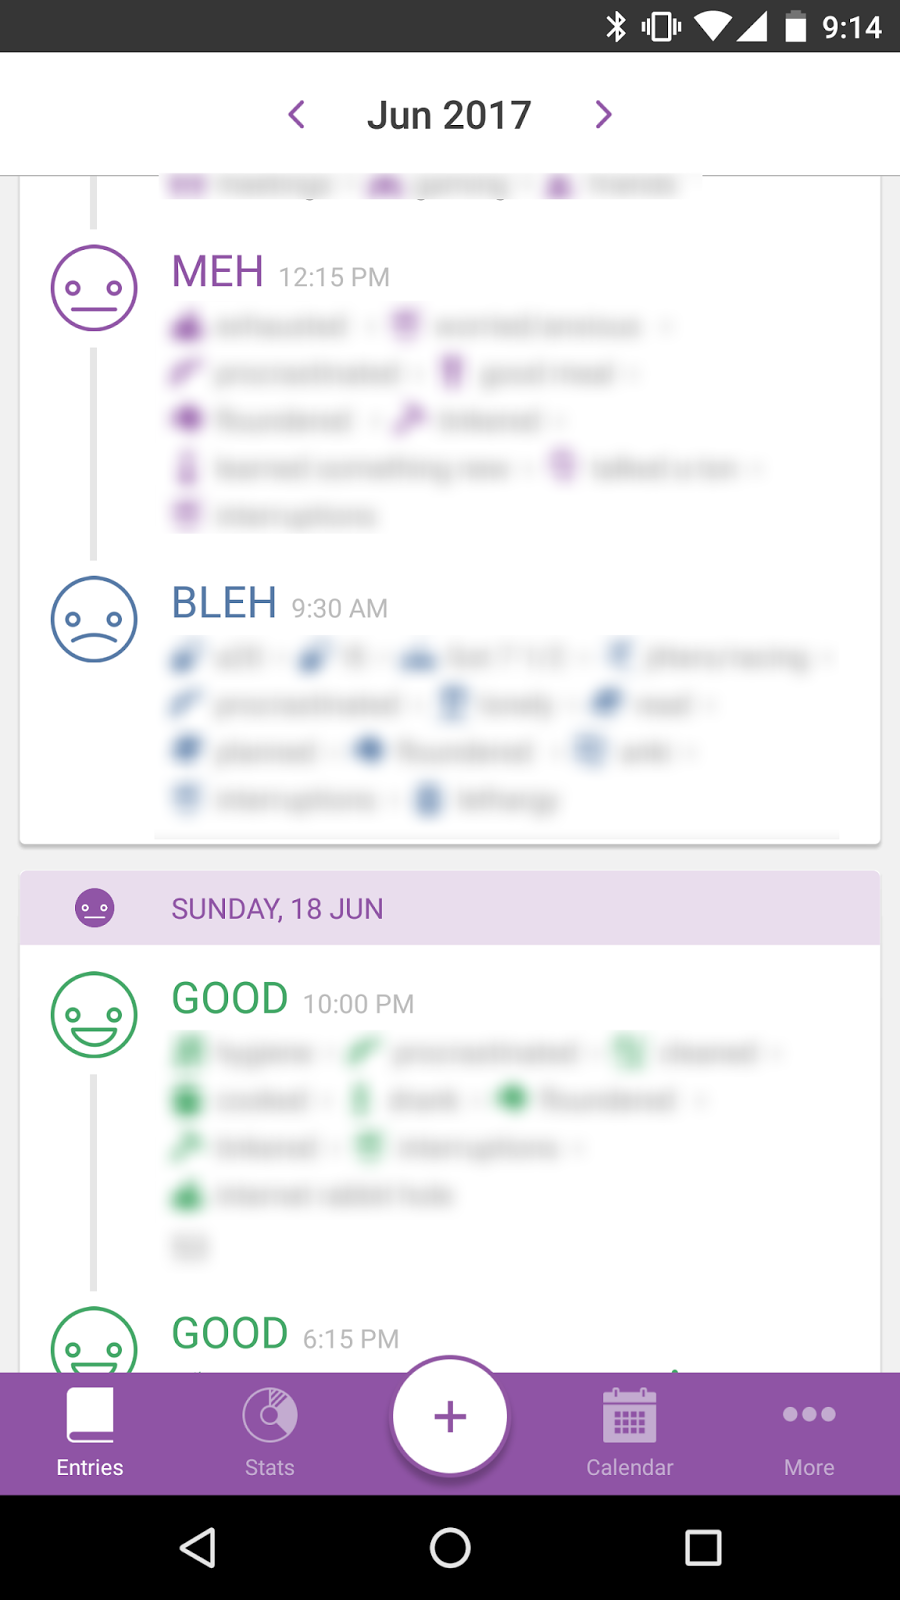
Using Daylio is easy enough. 5 times a day, I get a push notification that looks like this
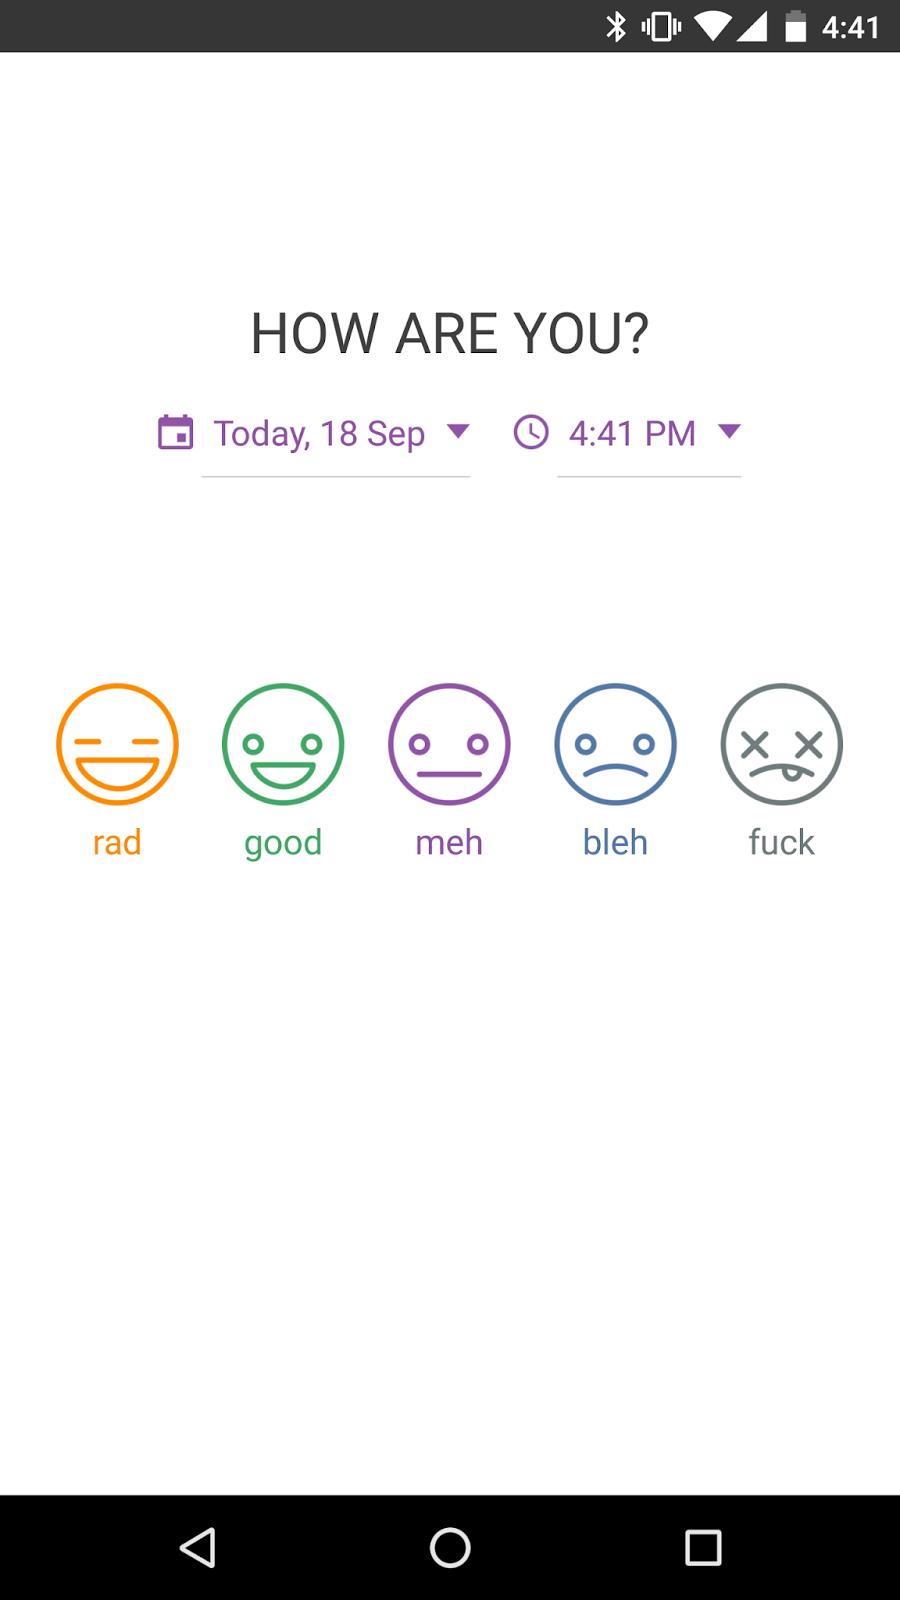
which basically prompts you for a 1-5 Likert Scale of your current mood. You can set as many alerts as you want, or just input your mood whenever you're so inclined. I just thought it made sense to catch some data at different cross-sections of the day and so I've got alerts coming at:
- 9:30a: Morning
- 12:15p: Lunch
- 3:00p: Afternoon
- 6:15p: End of Work Day
- 10:00p: Night
from here, you're taken to a page with a bunch of Tags and invites you to mark what you've done since the last time you checked in.
I should mention that all of the tags that you're selecting are ones that you build yourself. I honestly don't remember which ones the app comes with (if any), but with well-over 100 icons that you can select from, there's a huge diversity of things that you can choose to capture. It took me awhile to figure out what worked for me-- I'd wager that I have more tags than the average user, and by extension, probably way more than I actually need.
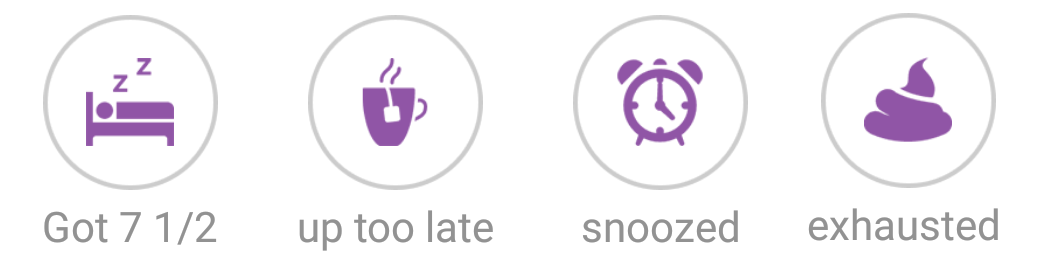
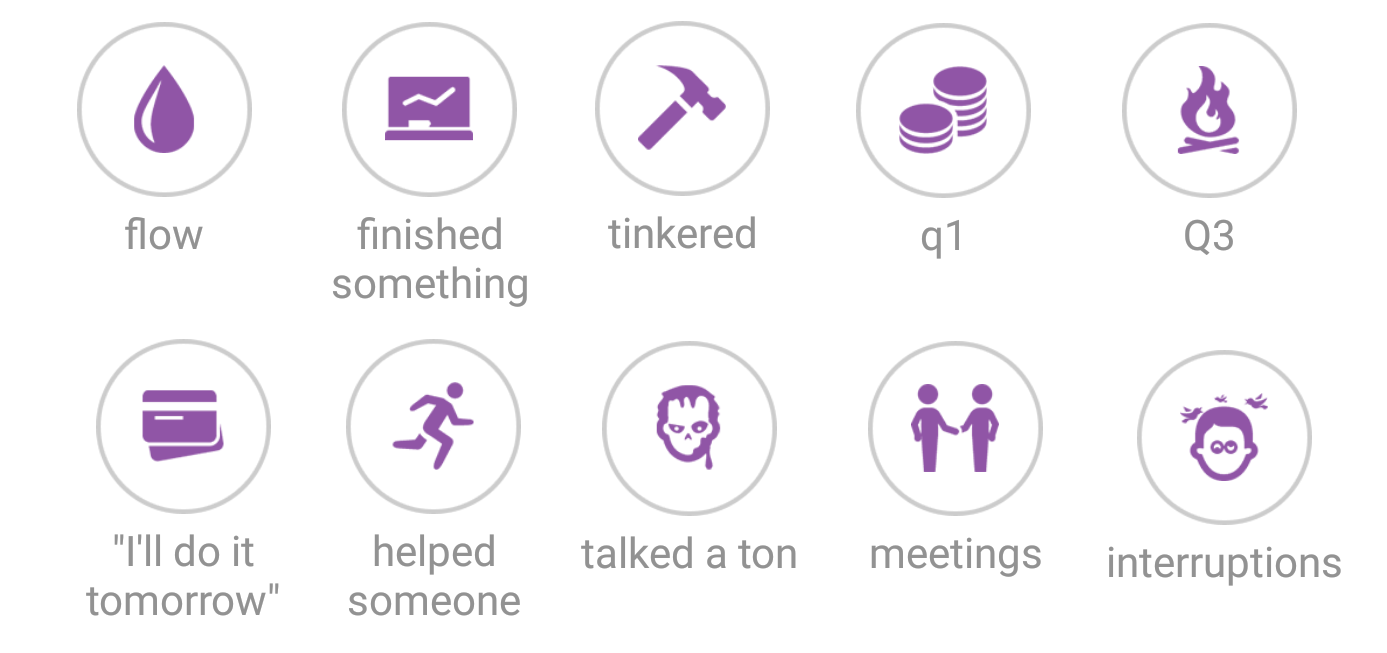
And so among other things, my tags are best summarized as:


So What?
A few months ago I was reading an older article titled "The Data-Driven Life" and came across a quote that hit me like a bucket of cold water.
"For many self-trackers, the goal is unknown. Although they may take up tracking with a specific question in mind, they continue because they believe their numbers hold secrets that they can’t afford to ignore, including answers to questions they have not yet thought to ask."
I'd been using Daylio consistently for a good while, but never tried to look at anything in aggregate because I wanted to ensure sufficient sample size. And even though I wasn't doing any kind of data analysis on the results, stopping to reflect and input how things were going served as a decent course-correction mechanism (when I'd let it)-- if there was an interruption at 2:00 and now I'm floundering and talking a ton, when I have to sit and input that at 3:00, maybe I make the decision to go hole up somewhere, close Skype and Outlook, and right the ship, yeah?
Of course, reading that article got the gears turning and I set out to suss out the "secrets that [I couldn't] afford to ignore" and develop strategies around them. After all, "the great aim of education is not knowledge, but action." - I could start to answer questions like: - What makes me tick? (whatever that means...) - How strong are the good habits I try to keep? - How much of my mood is momentum-based? (Spoilers: a lot) - I had this notion of "setting myself up for success" when I sleep well, or exercise, or plan my days. - Is there a difference in my mood when I don't? - ... and what's the effect of the inevitable pang of self-guilt when I don't stay on top of it?
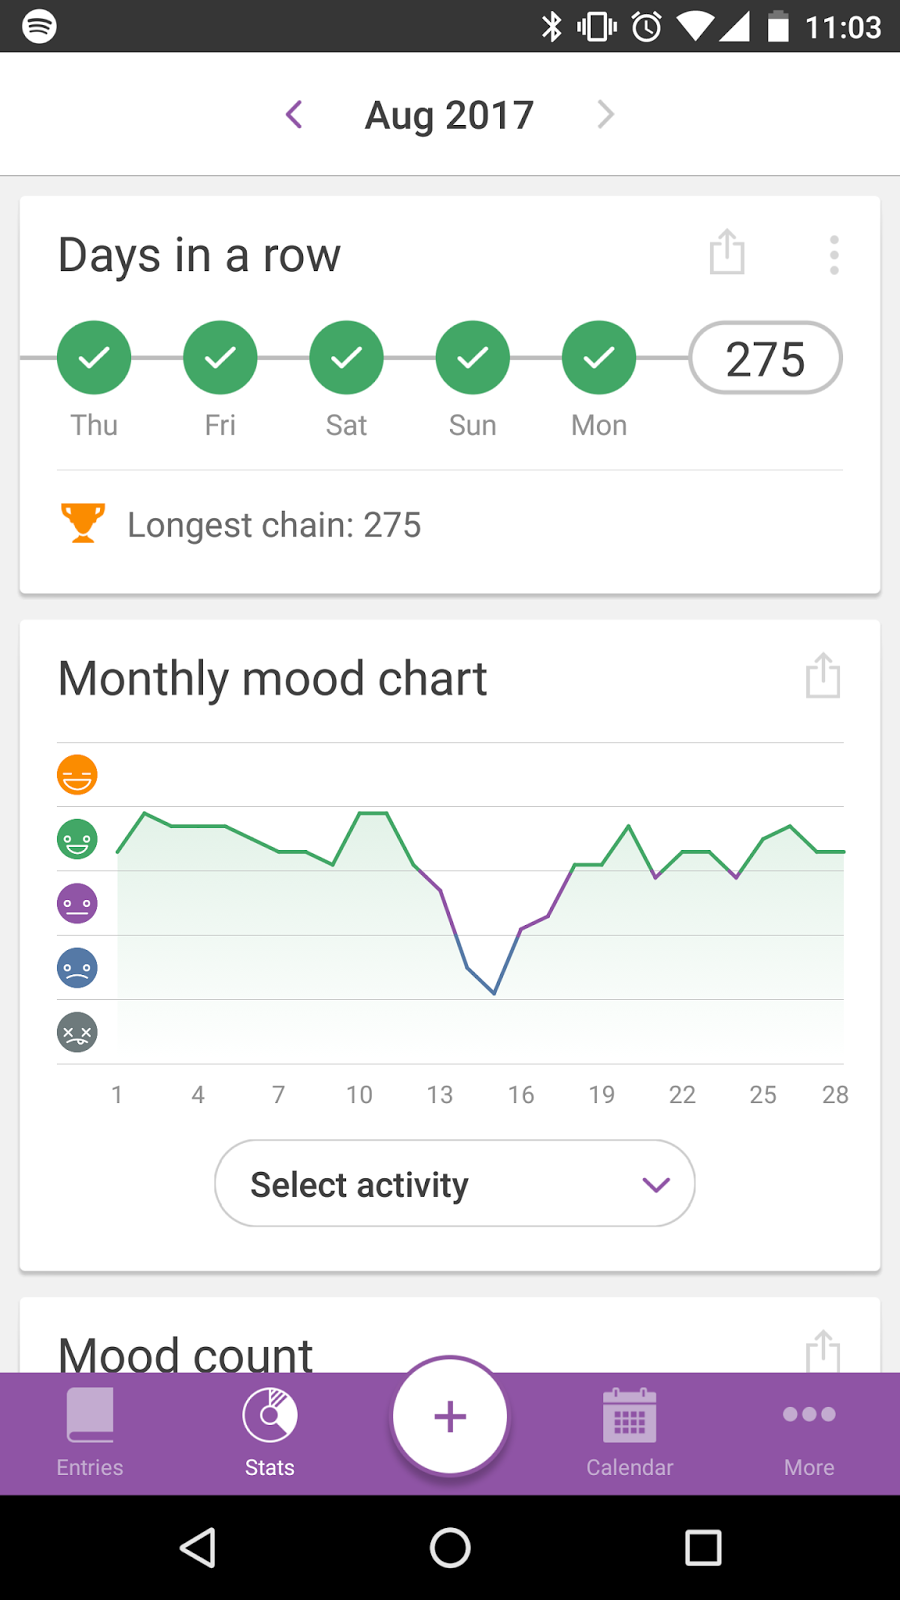
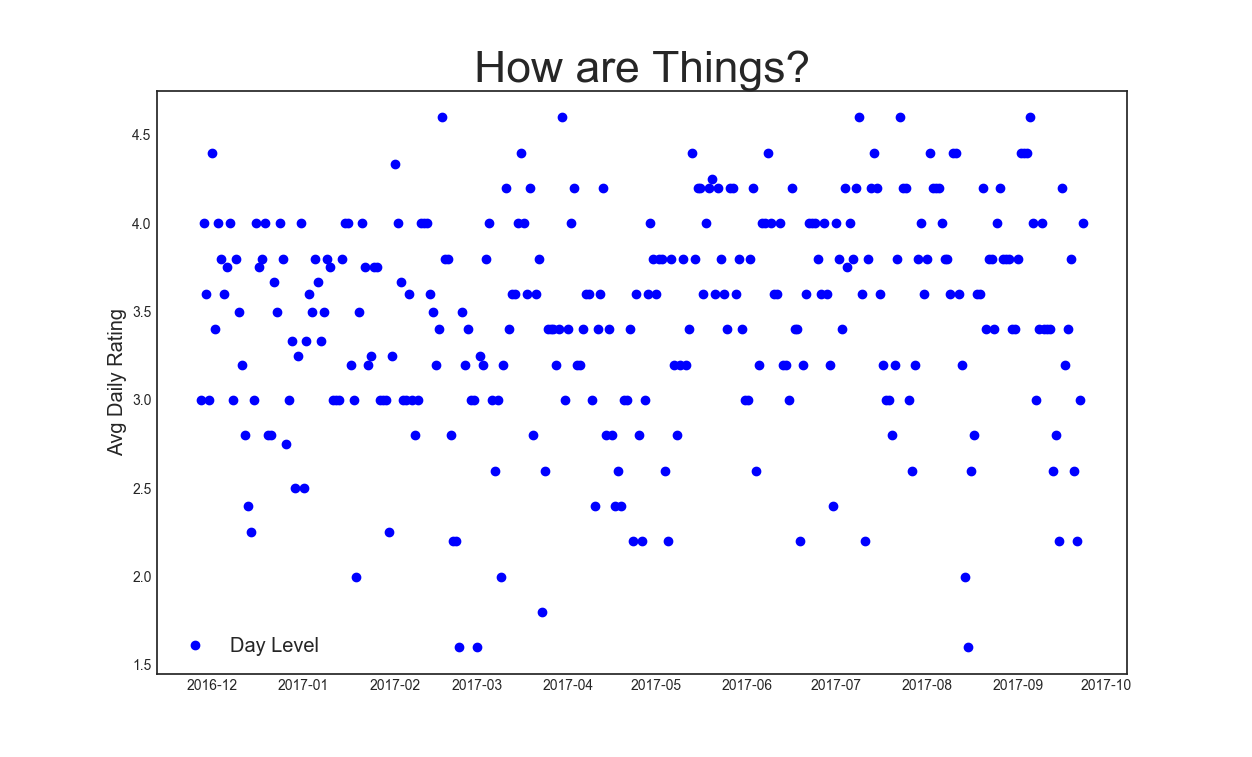
I wanted to understand what kinds of things drove a day that looked like this
Or have some intuition that explained dips like this
But the tool didn't do enough to answer that.
My chief concern with the "Stats" tab of the app, was that all of the data was windowed at the month-level. And so trying to get a picture of how your mental health is trending month over month involved a lot of dancing back and forth between the different pages, which is hardly scalable. Humans are very visual thinkers-- cycling through and trying to keep everything straight was untenable.
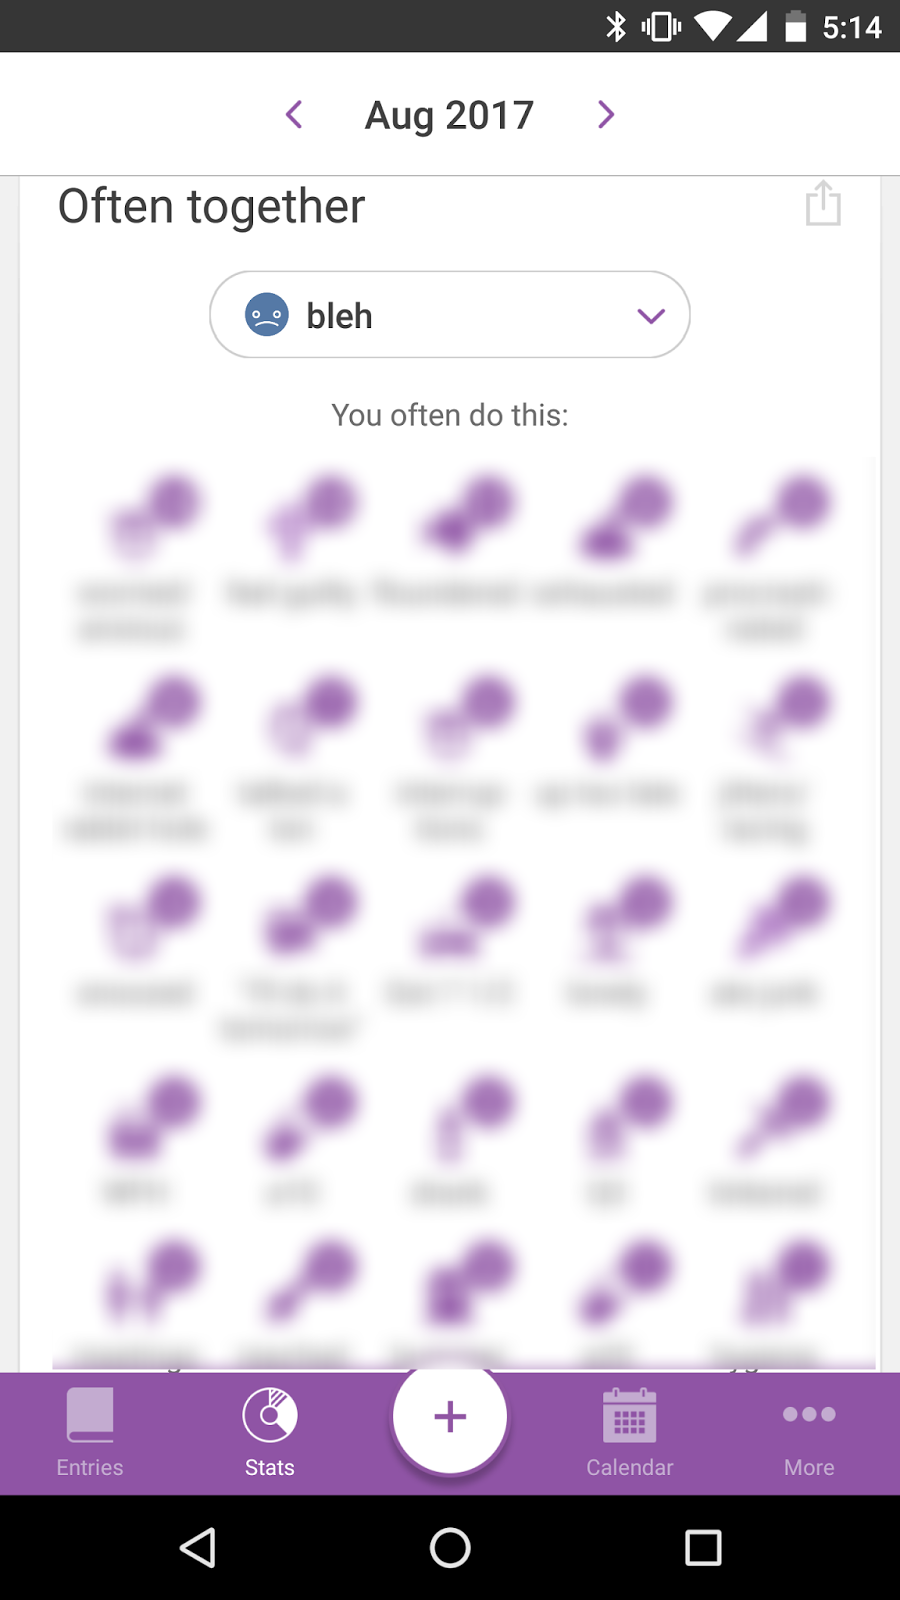
More frustrating yet, I couldn't get very good insight about the relationship between my Moods and Tags.
For example, I could click into the "Often Together" view and see that when I'm worried/anxious I'm typically doing Meh or worse.
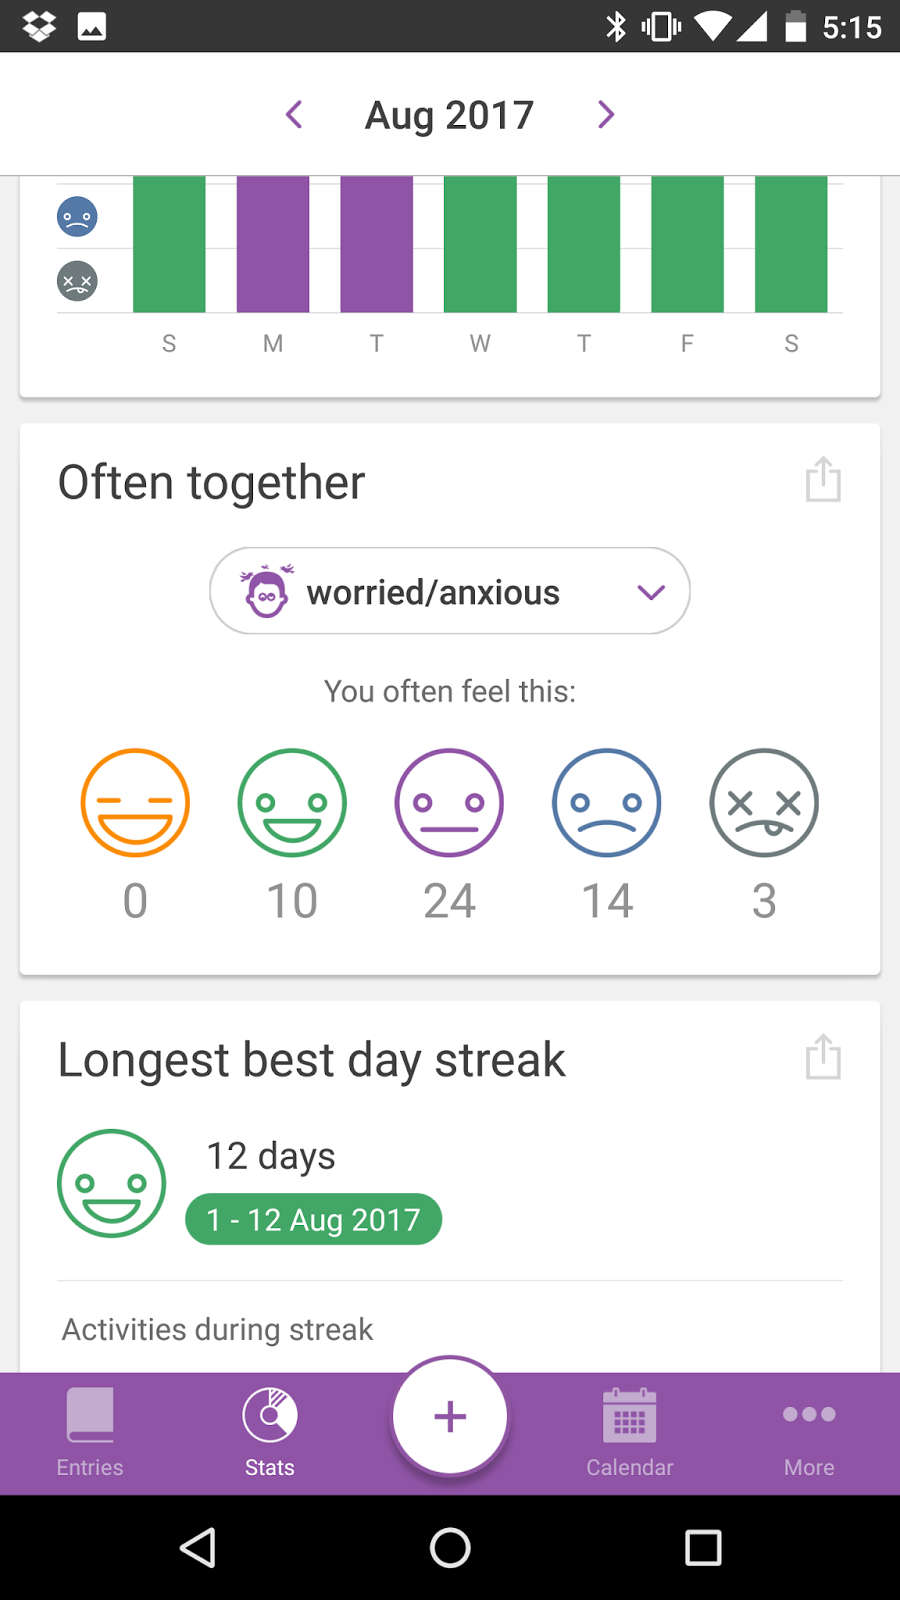
But I couldn't answer the effects of non-entries-- if I didn't get 7 1/2 hours of sleep, were those mornings better or worse than when I did? I also couldn't answer questions about the preceding and after-effects of Tags. How could I use this to determine if I drank more after I was having a rough go at it? (I'm happy to say that I'm, empirically, a strictly social drinker.)
I also couldn't examine the relationships between the different Tags. Not that it takes hard data science to gather that I'll often shower if I'm hitting the gym, or if I'm deliberately relaxing, there's probably a movie involved (what, because the name of the blog and all...). But I'd like to know things like "How often does the floundering Tag come on the heels of mornings that I took the time to plan. I'd wager fewer than those that don't.
Lastly, like the "Monthly Mood Chart" above, all of this "Stats" tab data is grouped at the month-level, so any significant trending in the nearly 300 days I've been collecting data is out of reach through just the app alone.
But then I found the "Export Data" functionality. It was time I finally rolled up my sleeves and did some data analysis.
Making the Data Useful
But the data dump looked crazy gross.
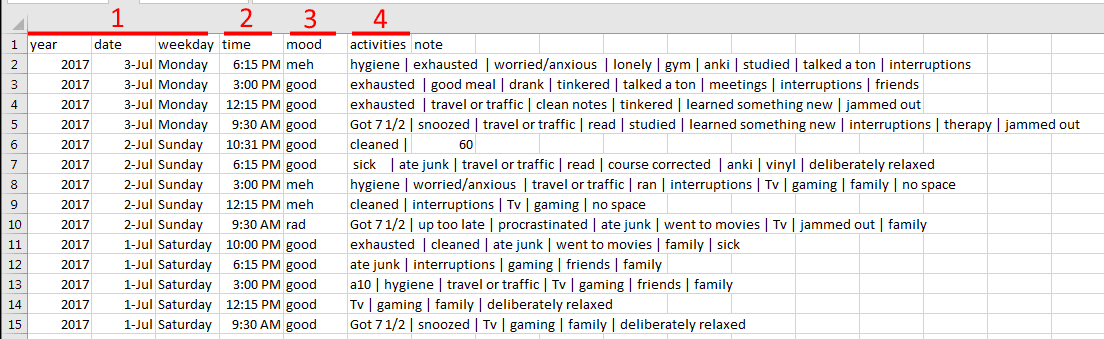
Specifically:
- The strange year, date, time formatting would need some cleaning/consolidating
- I'd self-imposed this morning/afternoon/etc paradigm. I would need a way to reflect that.
- For my analysis, moods needed to be mapped to numbers.
- My biggest hurdle: Bar-delimited Activities. Ugh.
Parked in front of a wealth of raw data, I had to save and walk away from the .csv, lest I get ahead of myself doing the first thing that came to mind. I was going to be doing some sort of automated data manipulation anyways, and so I needed to consider my problem space before I start solutioning.
What were some of the things that I wanted this data to do for me?
Intra-day movement. If I'm doing 5 Entries a day, I need the ability to interrogate each individual Entry, relative to that Entry's Mood. And then one step further, tie that Entry's Mood to the day and the Entries around it.
Ultimately, I'd do something like:
- Chronologically sort all of the Entries
- Find each Entry where the Mood value is 2-3 less than the one before it
- Get each of those Entries' Activity Tags
- Count and sort the frequency of each Tag
- ???
- Profit
Or if I wanted to keep track of my daily habits, I'd need to do some creative checking. Like if I wanted to know how well I was exercising, I'd
- Search each entry for a gym or ran Tag
- If either are there, code that Entry as a 1, otherwise a 0, as an "Exercised" flag
- Roll every Entry back to their relevant day and take the max value of that flag for the Entries in a given day.
- Therefore, if any of the Entries had one of the Tags, the whole day would reflect a value of 1. If none of them did, a 0.
This would allow me to go from ferreting through 5 Entries a day to just having a clean 0 or 1 value at the day level. From here, I can test my hypothesis that "The first time I don't go to the gym in a week, it makes it that much more likely that I'll skip the rest of the week." Maybe that might be common sense-- it's certainly an intuitive idea to me-- but knowing that for a fact and being able to capture when it's happening allows me to also have visibility into how well I'm course-correcting. A worthwhile endeavor, IMO.
So what I gather is that if I can get everything down to the Tag level, I can answer damn-near any question I want: Entry-level stuff by rolling the Tags up to the Entries. Same goes for Day-level stuff by rolling the Entries up to the Days. Time to get cleaning.
Hand-Wavy Technical Details
I spent a Sunday morning a couple weekends ago tinkering around in a Python/Database course. I'm very comfortable with SQL by nature of the day job, and with a data-design in mind, my goal was figuring out how to transform what I had into what I knew how to exploit.
I built out a few dim tables for things like "Mood," "TimeBucket," and "ActivityName" as well as two main tables-- one that captured every Entry, and another that captured each individual Activity selected in an Entry.
With the skeletons of the tables built, I turned my attention to parsing/transforming the .csv I got through the data dump. For each row I:
- Tossed out the data that I wouldn't use
- Transformed the dates into something usable
- Slotting each entry into "Morning/Lunch/Afternoon/Evening/Night" based on what time it was
- Mapped my moods to numbers
- Separated out and individually stored each Activity that I'd marked
I'd contend that 90% of my SQL experience at work is Reading data from our warehouse-- we have plenty of engineers dedicated to the Creation, Updating, and Deleting aspect. And so I learned a ton about ETL development through this little side-project. Not least of which was the majesty of the INSERT OR IGNORE command and CREATE TABLE ... CONSTRAINT arguments to save myself from a ton of duplicate data.
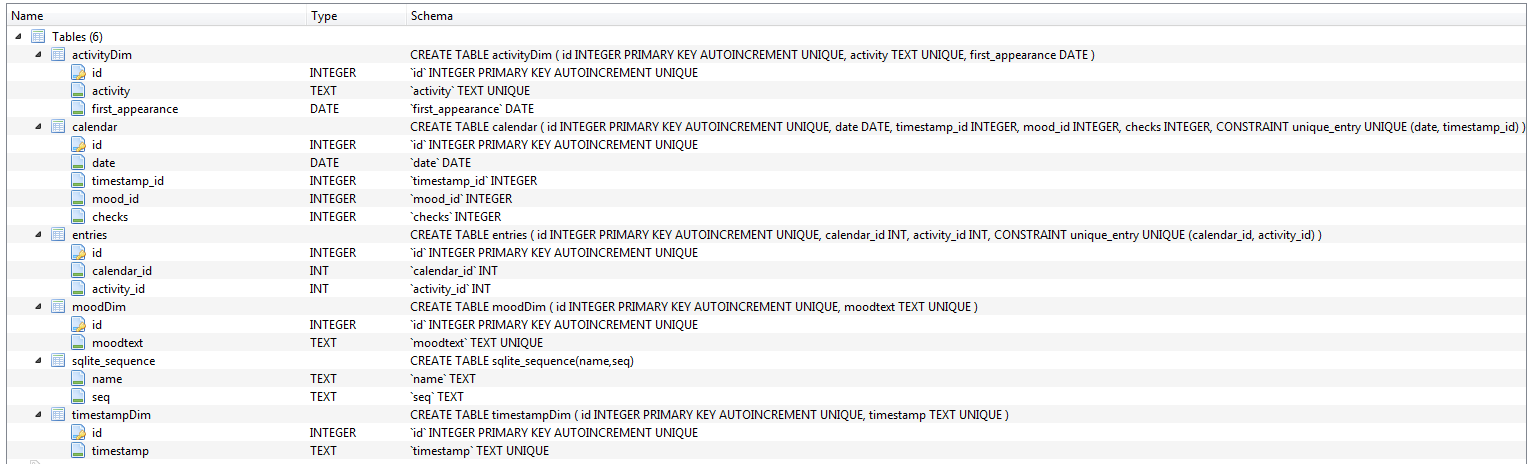
Here's the schema I wound up with, if anyone's interested.
Now What?
And so at the time of writing, I've got
- 301 Distinct Dates
- 1,426 Distinct Entries
- 10,851 Distinct Activity Tags
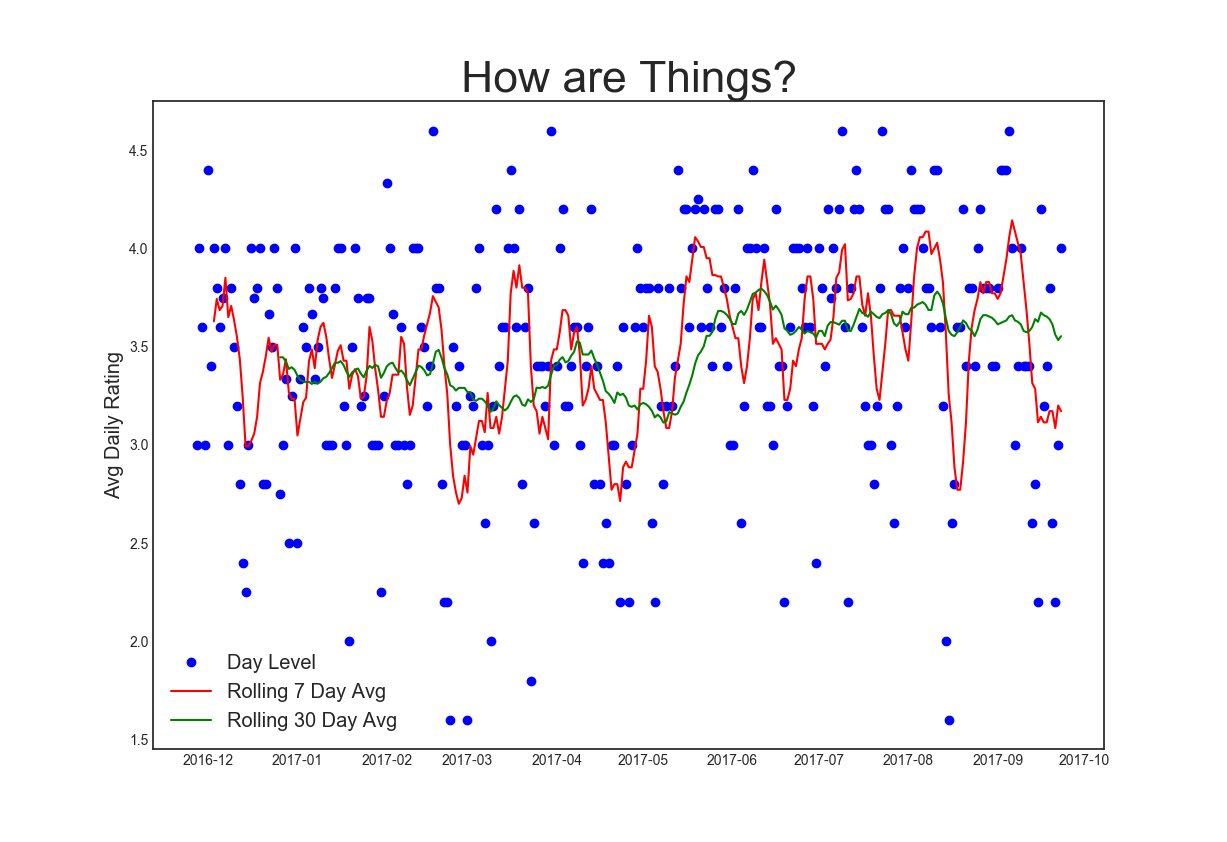
All told, that month-by-month view aggregates to
Which looks overwhelming, right? Lot of spikes on both sides. Some interesting whipsawing, for sure. But in my estimation, it's better to know than to not know. The alternative is feeling these things anyways and not being able to sort out why, and by extension of that, what to do about it.
And so I have tangible looks at how things are going at the expense of what, 15 seconds a few times a day? I'm okay with that trade-off. Because as I start to pay more attention, I'm, slowly but surely, figuring out how to take better care of myself.
Thanks for reading.
-Nick
Github link as always, though I've gotta caution against using it as-is. I did the majority of the work in Python 2 and then have since come around to being a 3 proponent (which could be a post in itself...).
I've been doing some tinkering with Dynamic SQL and dipping my toe into automating some Matplotlib calls (used to create the two visualizations above). Ideally, I'd like to abstract most of the analysis into function calls as well. This has me digging in on some library creation/project architecture. As it happens, that's also a big part of what I'm currently doing at work-- so expect a follow-up post regarding tooling and some of the more interesting things I'm finding in the data.
But not for another few months. I'd rather my next few posts had some levity :)